
Disclaimer: This article is written for educational purposes only and should not be considered medical advice, or be used to set a diagnosis or conduct treatment. See a health care professional for medical advice for medical opinions.
The basics
You Basal Body Temperature (BBT) can help you conceive faster by giving you pretty clear indications of which date you are ovulating. Why is this important? Because when you ovulate, an egg is released, it moves to your fallopian tube where it stays for 12-24 hours waiting to be fertilized. If you want to get pregnant, you need to optimize the chance of the sperm and egg being active at the same time, in the same place.
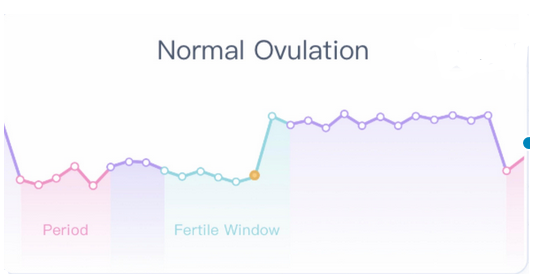
By tracking your BBT, you will see that your temperature remains low between your period and ovulation, and then does a jump the at the day of ovulation and stays high until your next period, where it drops again. The chart will typically look something like this (however a lot of us see discrepancies, which we will go through below):
By logging your temperatures, you can
- Determine when you ovulate (no, it’s not always day 14)
- Time sex
- Detect issues with your fertility, if you have any
Why not just have sex every day instead? Sure, you can do that. But life is not always that easy. By knowing when you ovulate you can plan a bit better (don’t go on that work trip that week), and if your man has a low sperm count, it can potentially be a good idea to “save” the sperm and release it as close to ovulation as possible.
How does it work – what do I do?
Your basal body temperature is your temperature when you’re fully at rest, and it needs to be measured the moment you wake up. No moving around, no going to the bathroom, the smallest effort makes your temperature jump. You open your eyes, you stick a thermometer in your mouth, and you note down the result.
To get the best results, you need to read the temperature at the same time every day (even on weekends!). Put your alarm on, and go back to sleep after if you want. +/- 60 minutes is fine, but not more.
Checklist:
- Wake up same time every day (for example 7:30)
- Have the thermometer next to the bed, it needs to go into the mouth immediately after waking up (no bathroom break first!)
- Always measure with the same technique (if you put it under your tongue on the left side, keep doing that, every day)
Things that might affect the accuracy of your readings:
- You got less than 4 hours of sleep before measuring your temperature
- You don’t measure the same time every day
- You did some activity (even small) before measuring
- You have been traveling across time zones
- You are sick and have a fever
- Your bedroom is unusually hot/cold
When am I most fertile?
2-3 days before your temperature rises. So you need to track your temperature for more than one cycle to start understanding your pattern. By tracking your pattern, you will quickly be able to determine when you ovulate, and have sex accordingly.
How often should we have sex
There are many opinions on this, some say every other day, some say every day (around fertility window).
The every-other-day suggestion seems to be based on two things: (1) Some couples find it stressful to have sex every day, and (2) it takes a bit of time to produce good sperm, if you empty the sac too often you might end up shooting blanks. If you have good quality sperm with a lot of activity in it (can be checked with a sperm test), then having sex every day is not a problem. But if activity is low and sperm count low, it might be a good idea to “save up” a few days before unleashing the soldiers.
The every-day suggestion seems to be based on a simple fact: The more you have sex, the more likely you are to get pregnant.
No matter how you frequently you decide to try, make sure to stay in bed, lying flat, for about 10 minutes after you are done. No need to get up and make it even harder for the sperm to find it’s way all the way in.
What about LH strips?
Yes, you should use these too. We will get back to that later.
Reading your BBT chart
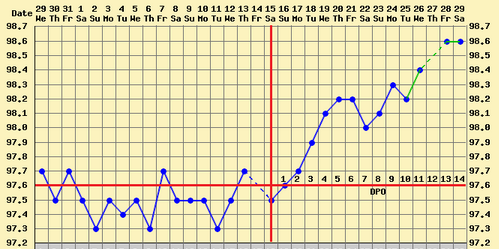
In women, BBT is affected by the hormones estrogen and progesterone. Before you ovulate, your body is dominated by estrogen which leads the temperature to stay low. The day after ovulation, progesterone dominates, and your BBT will increase. The temperature will drop again on the day your period arrives (sometimes 1-2 days before). See chart above for a “perfect chart” (in theory).
However, almost nobody has a chart like the above. Google “BBT charts” and you will see what the real world looks like. Let’s look at some common variations.
Common Variations
The Sloping Rise
If you have a sloping rise pattern, the thermal shift will be obvious however the temperatures will rise more slowly in a curved pattern. This normally takes a few days, rather than the solid jump the day after ovulation. Eventually, the temperature stabilizes half a degree above pre-ovulation temperatures.
The Slow Rise
Another completely normal variation is called “The Slow Rise”. Similar to the Sloping Rise, the rise in temperature is not apparent until a few days post ovulation. The difference between the two is that temperatures rise even slower/over a longer period of time, typically 4-6 days after ovulation.

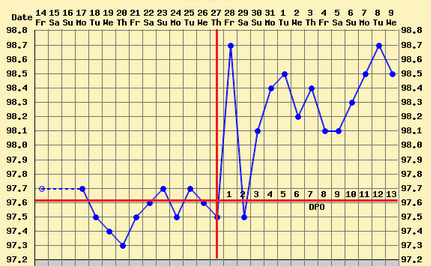
The Fallback Rise
The “Fallback Rise” (sometimes referred to as fallback thermal shift) the rise in temperature happens immediately after ovulation, however then drops the next day (sometimes it drops to below the coverline). However, it quickly jumps back on the 3rd day post ovulation and continues to remain high until your period.
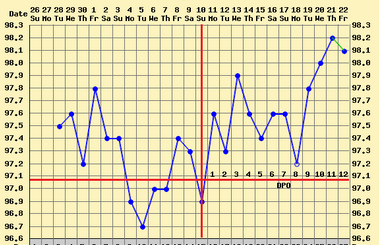
Then we also have the “Staircase Rise”, which is a pattern where it’s slightly more difficult to determine ovulation as the thermal shift is not always obvious. However if you ignore the day-to-day ups and downs, you will still see the overall pattern quite clearly.
Other irregularities
Ovulation Dip: A significant drop in temperature immediately before the thermal shift. This decrease is normally caused by an increase in estrogen immediately before ovulation. Far from everyone will see this dip in their chart.
Implantation Dip: A dip about a week++ after ovulation. Can be the result of a fertilized egg implanting in the wall (might be accompanied by bleeding). Far from everyone is experiencing this, and the dip does in no way guarantee you are pregnant.
Don’t worry too much if your charts seems irregular, a lot of women have regular ovulation despite their charts looking strange. But if your chart looks odd, it can be good to speak to your doctor about this and run tests to see that everything is fine (and if not, start solving that).

Leave a comment